Thailand:
Comprehensive National Policy Framework: PM2.5 and PM10 Suppression
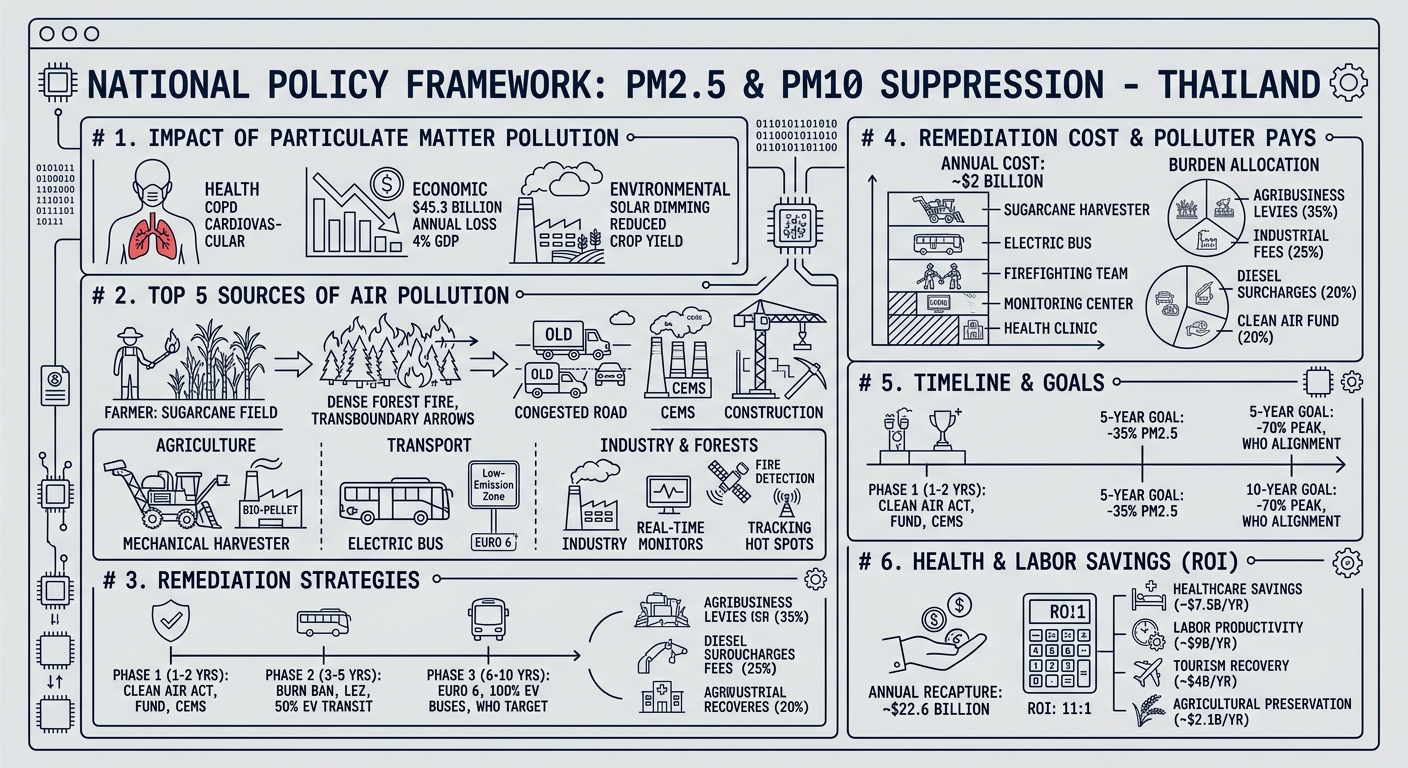
1. Actual Impact of Particulate Matter Pollution
Particulate matter (PM2.5 and PM10) represents one of Thailand’s most severe environmental, public health, and economic crises. The impact spans three main dimensions:
Health Impacts
- Mortality & Morbidity: Prolonged exposure contributes directly to chronic obstructive pulmonary disease (COPD), ischemic heart disease, stroke, lung cancer, and lower respiratory infections. Over 30,000 premature deaths annually in Thailand are attributed to fine particulate matter.
- Vulnerable Populations: Children experience diminished cognitive development and reduced lung growth, while elderly and outdoor workers suffer acute respiratory distress.
- Systemic Burden: Public hospitals experience significant seasonal surges in respiratory admissions during the dry season (December–April).
Economic & Labor Impacts
- Macroeconomic Loss: World Bank estimates indicate PM2.5 costs the Thai economy approximately $45.3 billion annually, equivalent to 3.89% to 4% of GDP.
- Labor Productivity & Absenteeism: High pollution days lead to measurable drops in worker output, elevated sick leave, and outdoor labor slowdowns in agriculture, logistics, and construction.
- Tourism & Commerce: Chronic seasonal smog degrades Thailand's appeal as a top global tourist destination, causes reduced retail spending, and lowers regional real estate values.
Environmental & Ecosystem Impacts
- Reduction in agricultural crop yields due to solar radiation blockage (solar dimming) and ozone co-pollutants.
- Acidification and soil deposition affecting sensitive ecosystems in northern national parks.
2. Top 5 Sources of Air Pollution in Thailand
Top 5 Emission Sources
- Agricultural Biomass Burning: Field burning to clear sugarcane (pre-harvest burning), maize stubble, and rice straw remains the largest seasonal driver of PM2.5 across northern, northeastern, and central plains.
- Transboundary Haze & Forest Fires: Wildfires triggered by agricultural encroachment, alongside seasonal open burning in neighboring Mekong Subregion nations (Myanmar, Laos, Cambodia), carry transboundary particulate plumes across Thailand.
- Vehicle Exhaust (Diesel Fleet): Dense urban areas—particularly the Bangkok Metropolitan Region—suffer year-round baseline pollution driven by older diesel-powered buses, trucks, and unmaintained light vehicles coupled with atmospheric inversion during winter months.
- Industrial Emissions & Power Generation: Heavy manufacturing, cement plants, biomass power plants, and coal/gas-fired utilities contribute significant sulfur dioxide (SO2), nitrogen oxides (NOx), and direct particulate matter.
- Construction Dust & Fugitive Mining Dust: Uncontrolled dust emissions from massive urban infrastructure development, commercial building projects, and quarry operations drive localized PM10 elevation.
3. Best Practices for Remediation & Policy Execution
To achieve durable suppression, Thailand must transition from reactive emergency measures to structural, policy-backed interventions:
National Remediation Strategy by Sector
| Agriculture | Transport | Industry & Forests |
|---|---|---|
| • Zero-burn subsidies • Bio-pellet processing • Sugarcane mill bans on burned cane |
• Transition to Euro 6/VI fuel standards • Electrify bus fleets • Low-Emission Zones (LEZs) |
• Mandate continuous emissions monitoring • Satellite forest fire detection networks |
- Agricultural Waste Transformation:
- Incentivize mechanical harvesters for sugarcane and establish localized collection centers to convert rice and corn straw into bio-pellets, animal feed, and biochar.
- Implement strict penalties and mill purchasing bans on burned sugarcane.
- Vehicle & Transport Reforms:
- Accelerate the transition from Euro 4 to Euro 6 emission standards for all new heavy-duty commercial vehicles.
- Expand Low-Emission Zones in urban centers, restricting high-emission diesel trucks during peak pollution months.
- Electrify public transit fleets (buses, boats, municipal vehicles).
- Industrial & Energy Controls:
- Mandate Continuous Emission Monitoring Systems (CEMS) directly connected to the Pollution Control Department (PCD) for all major factories.
- Cap SO2 and NOx emissions to mitigate secondary particulate formation.
- Forestry & Transboundary Management:
- Implement satellite-based early detection networks combined with community-led fire management incentives.
- Leverage the ASEAN Agreement on Transboundary Haze Pollution to enforce regional cross-border accountability frameworks.
4. Cost of Remediation & Allocation of Financial Burden
Remediation Cost Estimation
An effective national 10-year remediation program requires an estimated $1.8 billion to $2.2 billion per year (approx. 65–80 billion THB/year).
| Program Sector | Annual Estimated Cost | Key Allocation |
|---|---|---|
| Agricultural Machinery & Bio-Hubs | $700 Million | Subsidies for harvesters, processing plants, bio-pellet supply chains |
| Transport Electrify & Standards | $600 Million | Public fleet electrification, retrofitting diesel engines |
| Forest Management & Monitoring | $300 Million | Firefighting equipment, satellite tracking, community forestry funds |
| Industrial Auditing & CEMS Integration | $200 Million | Regulatory enforcement, monitoring equipment subsidies |
| Public Health & Clean Air Hubs | $200 Million | Air filtration systems in public schools/hospitals, mask distribution |
Cost Allocation (Polluter Pays Principle)
- Agribusiness & Large Farms (35%): Carbon tax and agricultural levies on large supply chains.
- Industrial Emitters (25%): Industrial pollution fees and stack-emission penalties.
- Transport Fleet Operators (20%): Diesel fuel tax surcharges and registration fees for older vehicles.
- National Clean Air Fund (20%): Government budgetary allocation, green bonds, and international grants.
5. Timeline & Targeted Reduction Goals
Key Targets
- 5-Year Goal: Reduce national average ambient PM2.5 concentrations by 35%, keeping maximum daily averages below safe thresholds.
- 10-Year Goal: Achieve full alignment with World Health Organization (WHO) Interim Target-4 ($15\,\mu\text{g/m}^3$ annual mean) and reduce overall seasonal peak episodes by 70%.
10-Year Implementation Roadmap
| Phase 1: Years 1–2 (Enactment & Foundations) | Phase 2: Years 3–5 (Expansion & Scale) | Phase 3: Years 6–10 (Maturity & Maintenance) |
|---|---|---|
| • Pass Clean Air Act • Establish Clean Air Fund & Polluter Fees • Mandate CEMS for top 1,000 factories |
• Full ban on burned sugarcane buying • LEZs in major cities • 50% EV public transit • Regional haze treaties |
• Euro 6 enforcement nationwide • 100% electrified urban bus fleets • WHO Target alignment |
6. Economic Benefit Calculation: Health & Labor Savings
A successful reduction in PM2.5 yields massive returns compared to the investment required.
Annual Economic Savings Model
Assuming a 50% reduction in particulate pollution achieved within Phase 2 (Year 5): * Baseline Annual Loss: $\approx \$45.3\text{ billion}$ (3.89% of GDP) * Targeted Pollution Reduction: $50\%$ * Direct Annual Economic Recapture: $\approx \$22.6\text{ billion / year}$
Annual Benefit Distribution
- Healthcare Cost Reductions: ~$7.5 Billion / Year (fewer hospitalizations for stroke, asthma, COPD)
- Recaptured Labor Productivity: ~$9.0 Billion / Year (elimination of lost workdays, improved cognitive/outdoor labor output)
- Tourism & Retail Recovery: ~$4.0 Billion / Year (elimination of severe seasonal smog in major cities and resort destinations)
- Agricultural Yield Preservation: ~$2.1 Billion / Year (higher crop yields from unblocked solar radiation)
Return on Investment (ROI): Spending ~$2.0 billion annually on remediation yields ~$22.6 billion annually in economic and health savings—representing an extraordinary 11:1 benefit-to-cost ratio for the nation.